The Ichthyofauna Monitoring Program aims to continuously monitor fish communities (ichthyofauna) in water bodies related to projects under concession by Copel, identifying possible changes in the community over time, generating scientific information and guidance for management actions and meeting environmental conditions. This plan does not cover ichthyofauna monitoring related to compliance with the Basic Environmental Program (PBA) of projects under construction and applies to projects in operation located in the State of Paraná and the State of Mato Grosso.
Ichthyofauna monitoring is carried out through periodic collections of fish in the study sites, following a scientific methodology. The data obtained generate periodic technical reports. From a scientific point of view, the main benefit is the recording of the biology and ecology of ichthyofauna species and the interaction of this community with environmental variations. For the Iguaçu River basin, the record of new, endemic and endangered species stands out, such as the Cambeva igoby, an endemic and endangered fish discovered in the Iguaçu River basin. This fish is one of the targets of the Iguaçu Fish Conservation Action Plan – PAN Iguaçu.
Monitoring allows the monitoring of fish communities in 18 reservoirs under concession by Copel GeT, providing support for the implementation of conservation actions, such as reproduction and restocking activities carried out at the Experimental Ichthyology Study Station (EEEI). It also allows Copel to be aware of the situation of each reservoir in relation to ichthyofauna, allowing for rapid responses to internal and external clients and environmental agencies in atypical situations related to fish, in addition to maintaining the Operating License of several enterprises where ichthyofauna monitoring is an environmental condition.
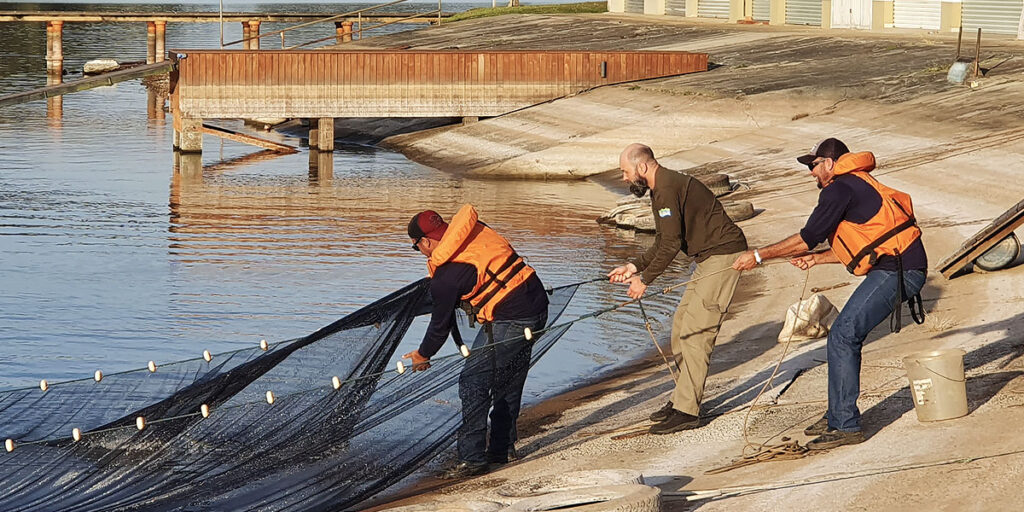
Figure 1: Trawl collection
Figure 2: Collection of fish eggs and larvae.
Figure 3: Fish collection with a cast net.
Figure 4: Collection with standby net.
Figure 5: Registration of biometric data.
Figure 6: Release after data collection.
Figure 7: Laboratory activities.
Figure 8: Reporting.
Figure 9: STP – location of one of the antennas.
Figure 10: STP – fish observation display.
Figure 11. External individual T-tag tagging system.
Figure 12: Internal PIT-tag individual marking system.


